Graph Builder for Visualization
Introduction
Welcome to the Graph Builder tutorial! The Graph Builder is a powerful tool within R!AN that allows you to create interactive visualizations of your data fabric. By representing your data fabric graphically, you can:
- Run Graph Queries: Explore your data using graph database query languages like Cypher.
- Train Graph Neural Networks (GNNs): Use graph data to train advanced machine learning models.
- Gain Deeper Insights: Uncover hidden patterns and relationships within your data.
This tutorial will guide you through the steps to effectively use the Graph Builder and visualize your data in Neo4j.
Prerequisites
Before you begin, ensure that you have:
- Completed the initial setup of R!AN.
- Added at least one data source.
- Created a data fabric using the steps outlined in the Getting Started Guide.
- Access to a Neo4j instance (local or remote) where the graph will be visualized.
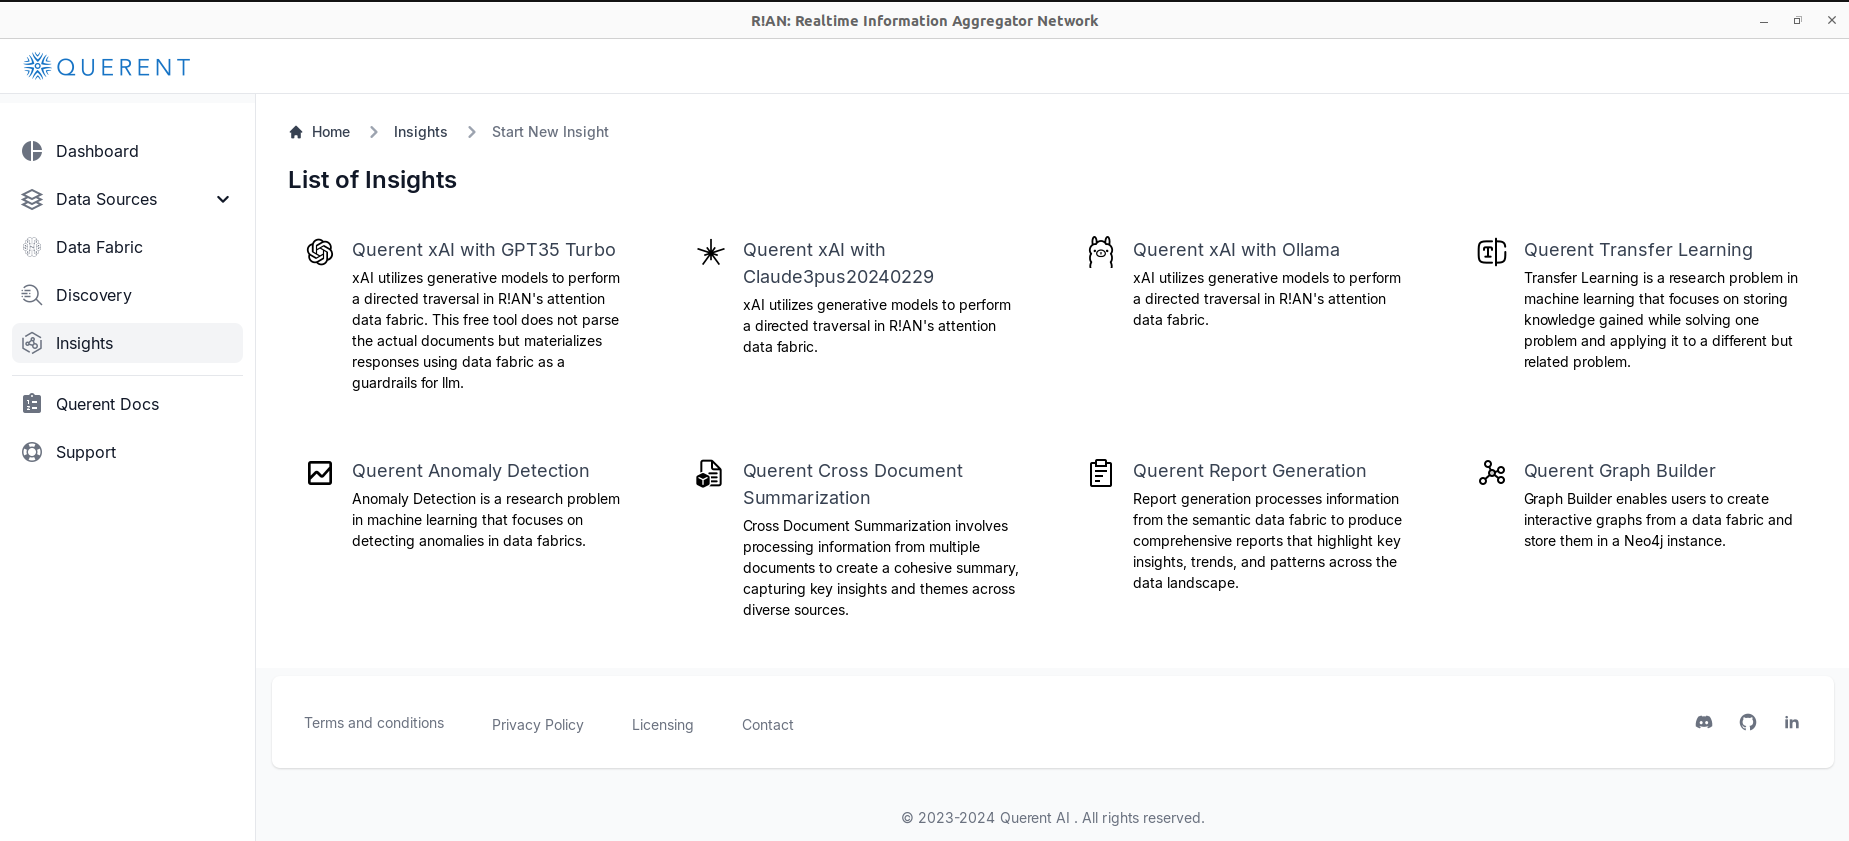
Accessing the Graph Builder
Follow these steps to access the Graph Builder within R!AN:
-
Navigate to Insights:
-
Click on Insights in the left-hand menu.
-
-
Select Graph Builder:
-
From the list of available insights, selectGraph Builder.
-
Building Your First Graph
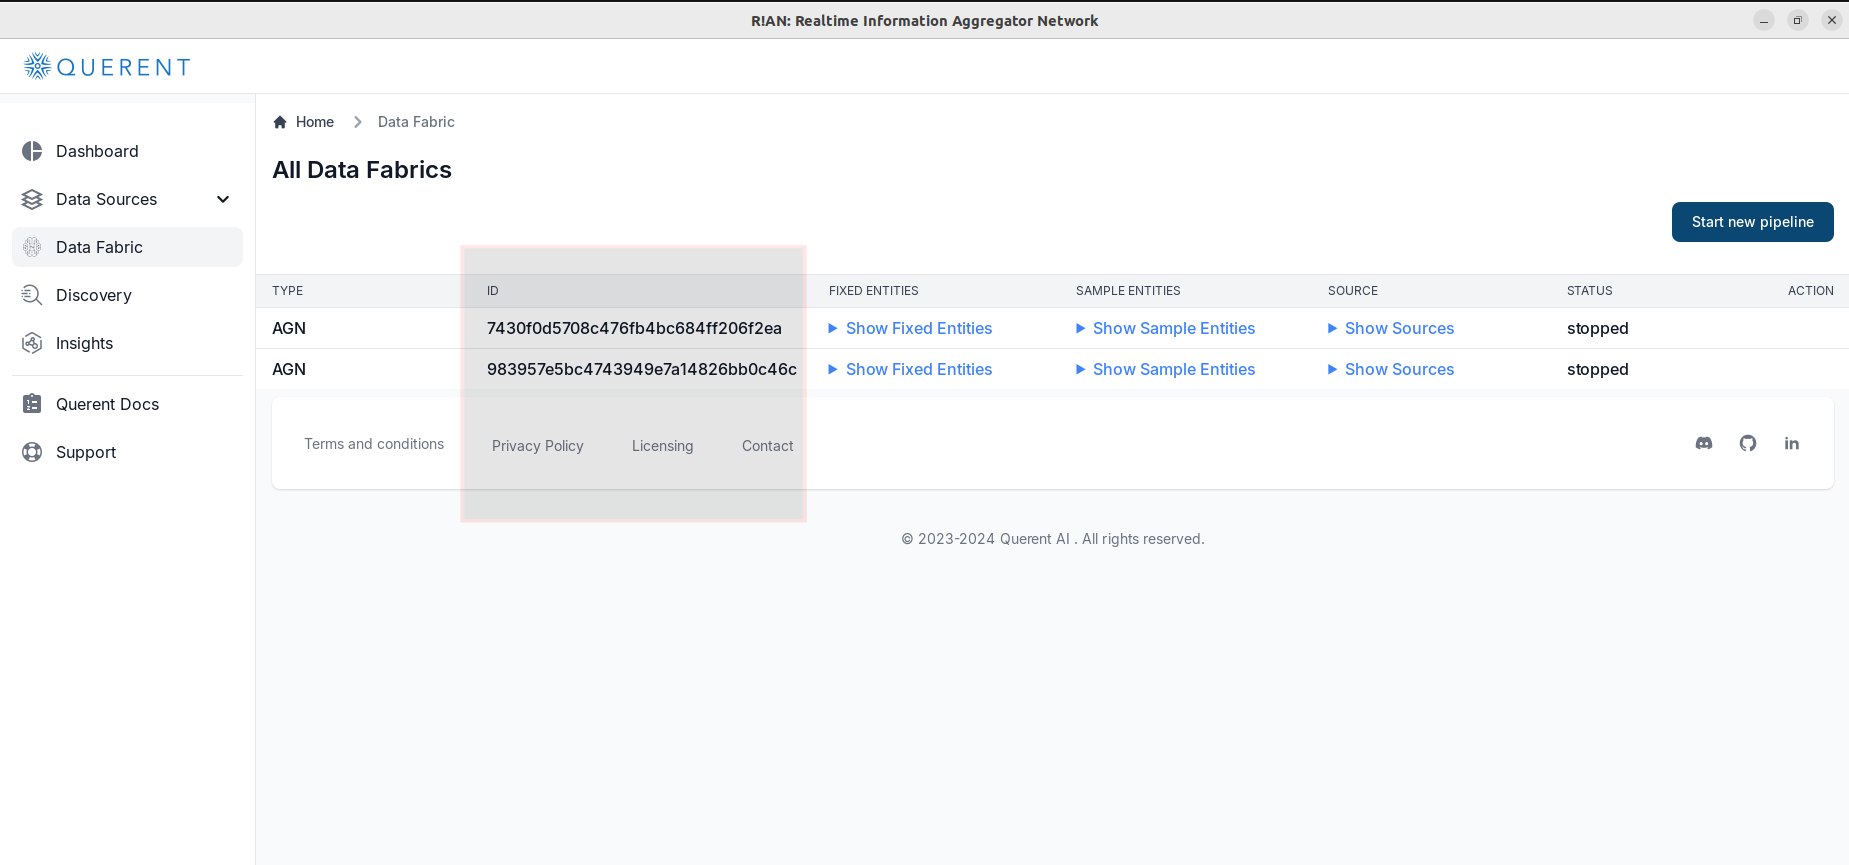
Step 1: Select Data Fabric
-
Enter the Data Fabric ID:
-
In the Data Fabric ID field, enter the ID of the data fabric you wish to visualize.
-
You can retrieve the Data Fabric ID from the Data Fabric section.
-
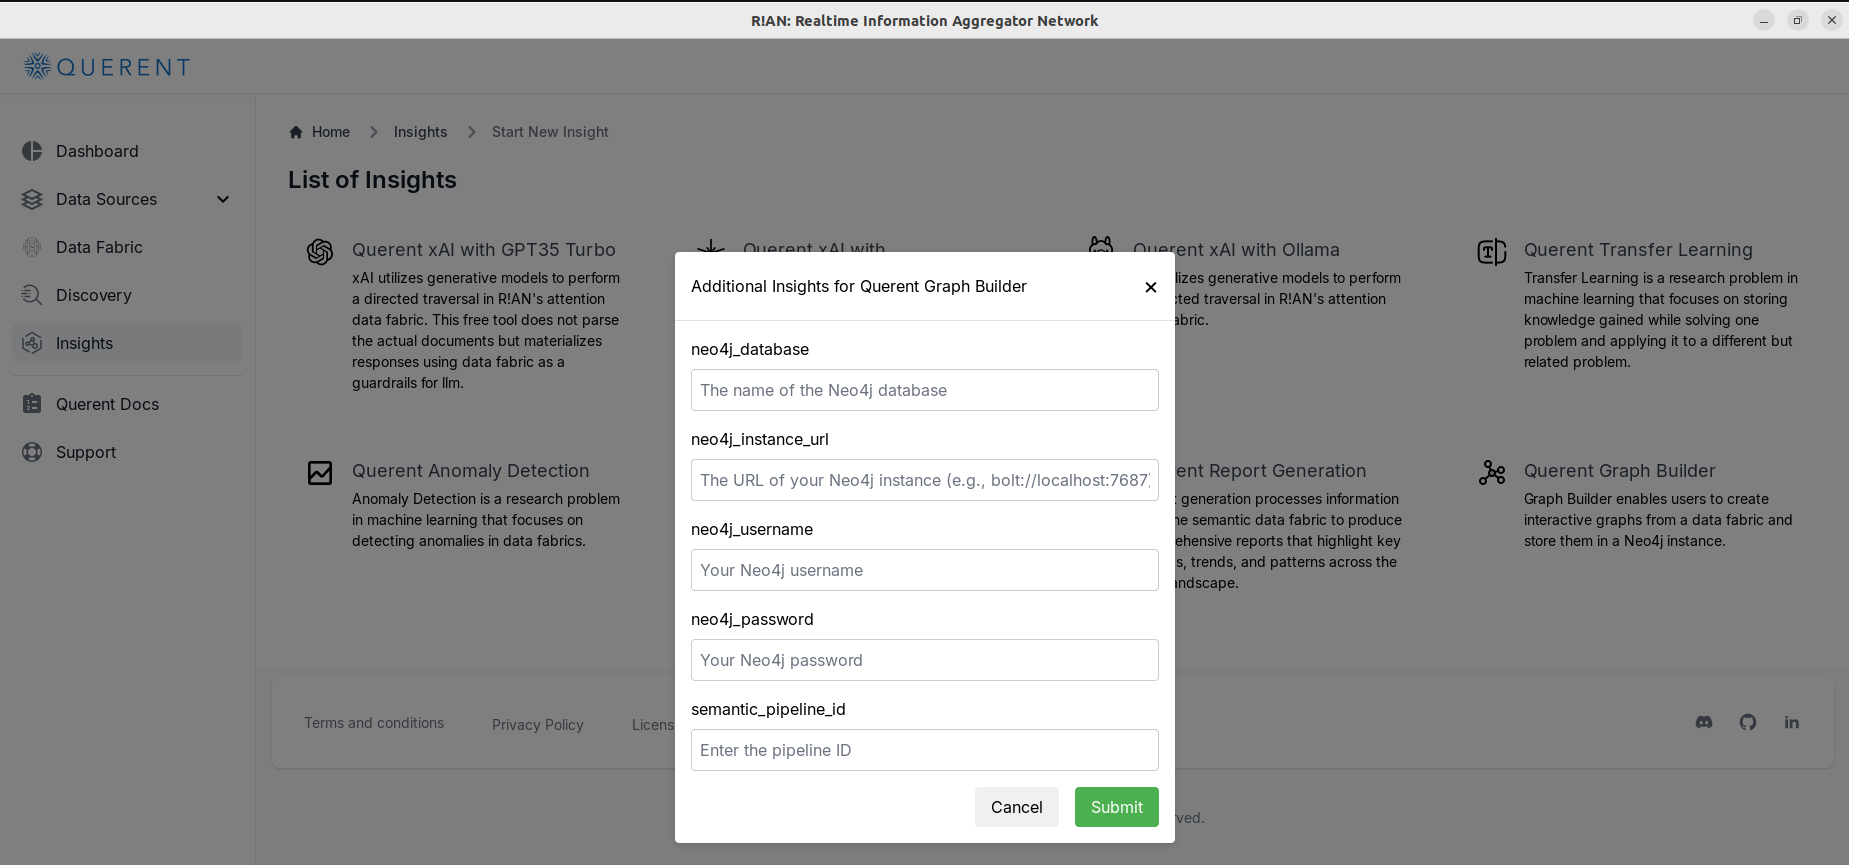
Step 2: Configure Neo4j Connection Parameters
To export your data fabric to a Neo4j graph database, provide the connection details of your Neo4j instance.
-
Enter Neo4j Connection Details:
-
Username: Enter your Neo4j username (default is usually
neo4j). -
Password: Enter your Neo4j password.
-
Database Name: Specify the Neo4j database name where you want to import the graph (default is
neo4j). -
Instance URL: Provide the Bolt protocol URL of your Neo4j instance (e.g.,
bolt://localhost:7687).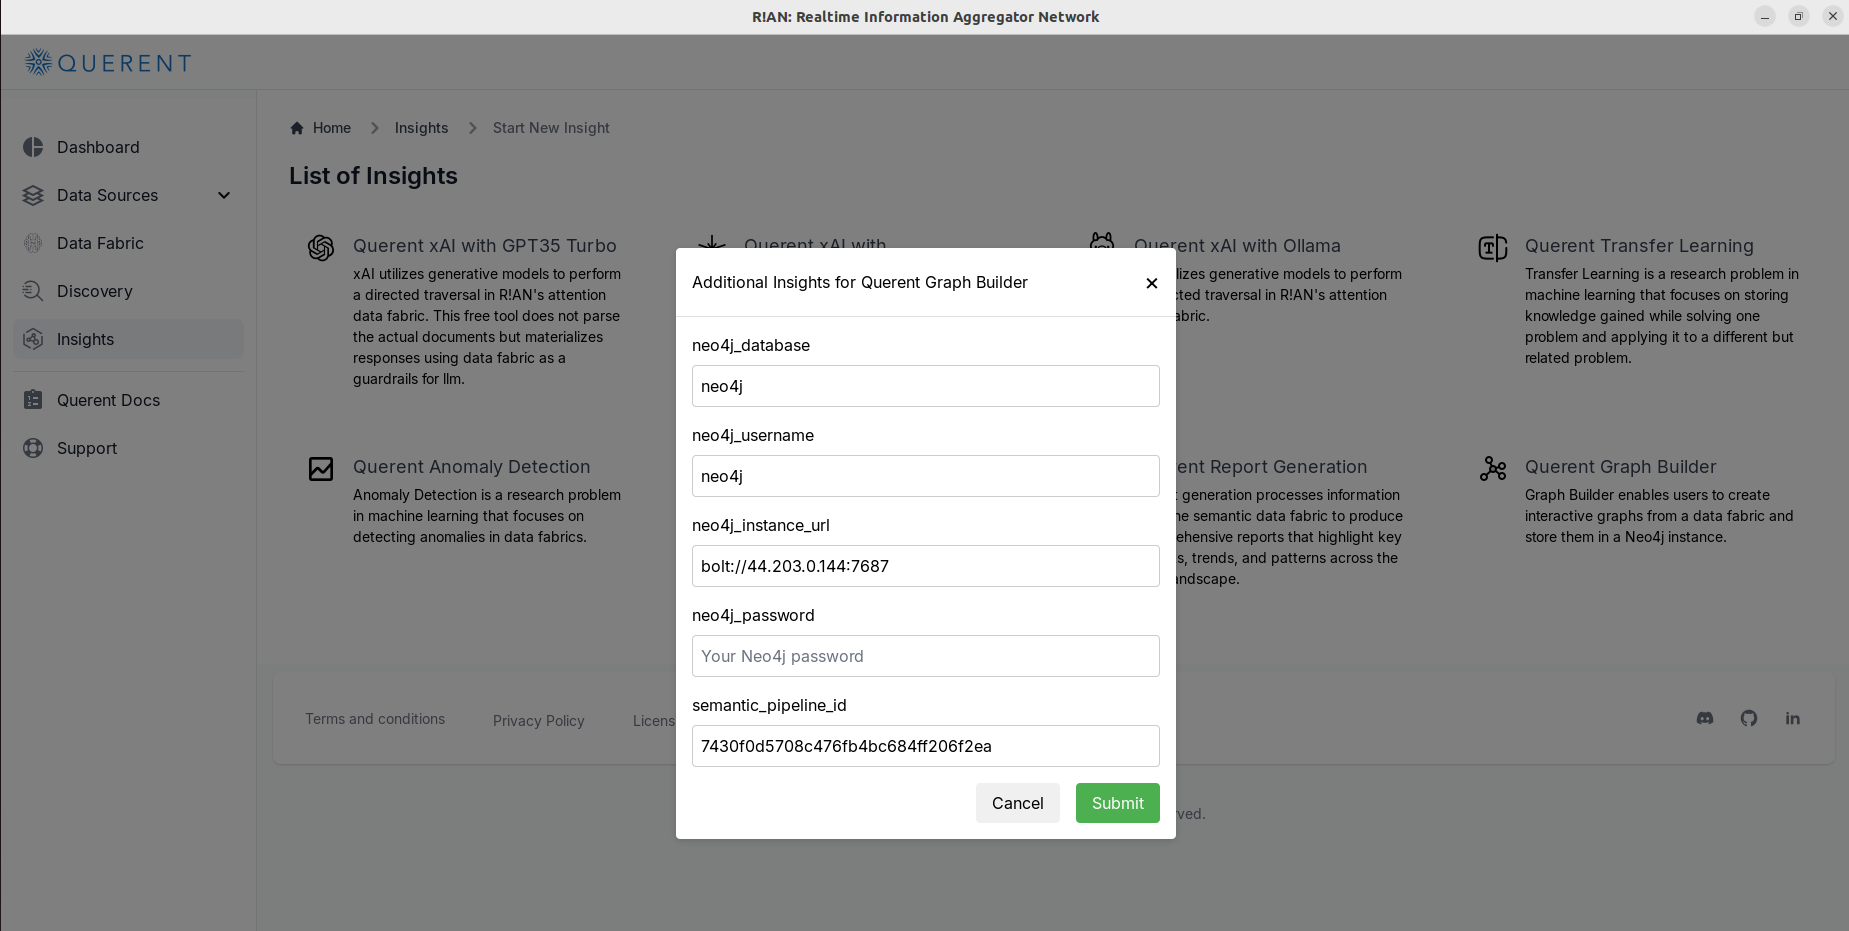
Note: Ensure that your Neo4j instance is running and accessible from your machine.
-
Step 3: Generate Graph
-
Submit the Configuration:
- Click on the Submit button to start exporting your data fabric to Neo4j.
- R!AN will process your data fabric and load it into the specified Neo4j database.
-
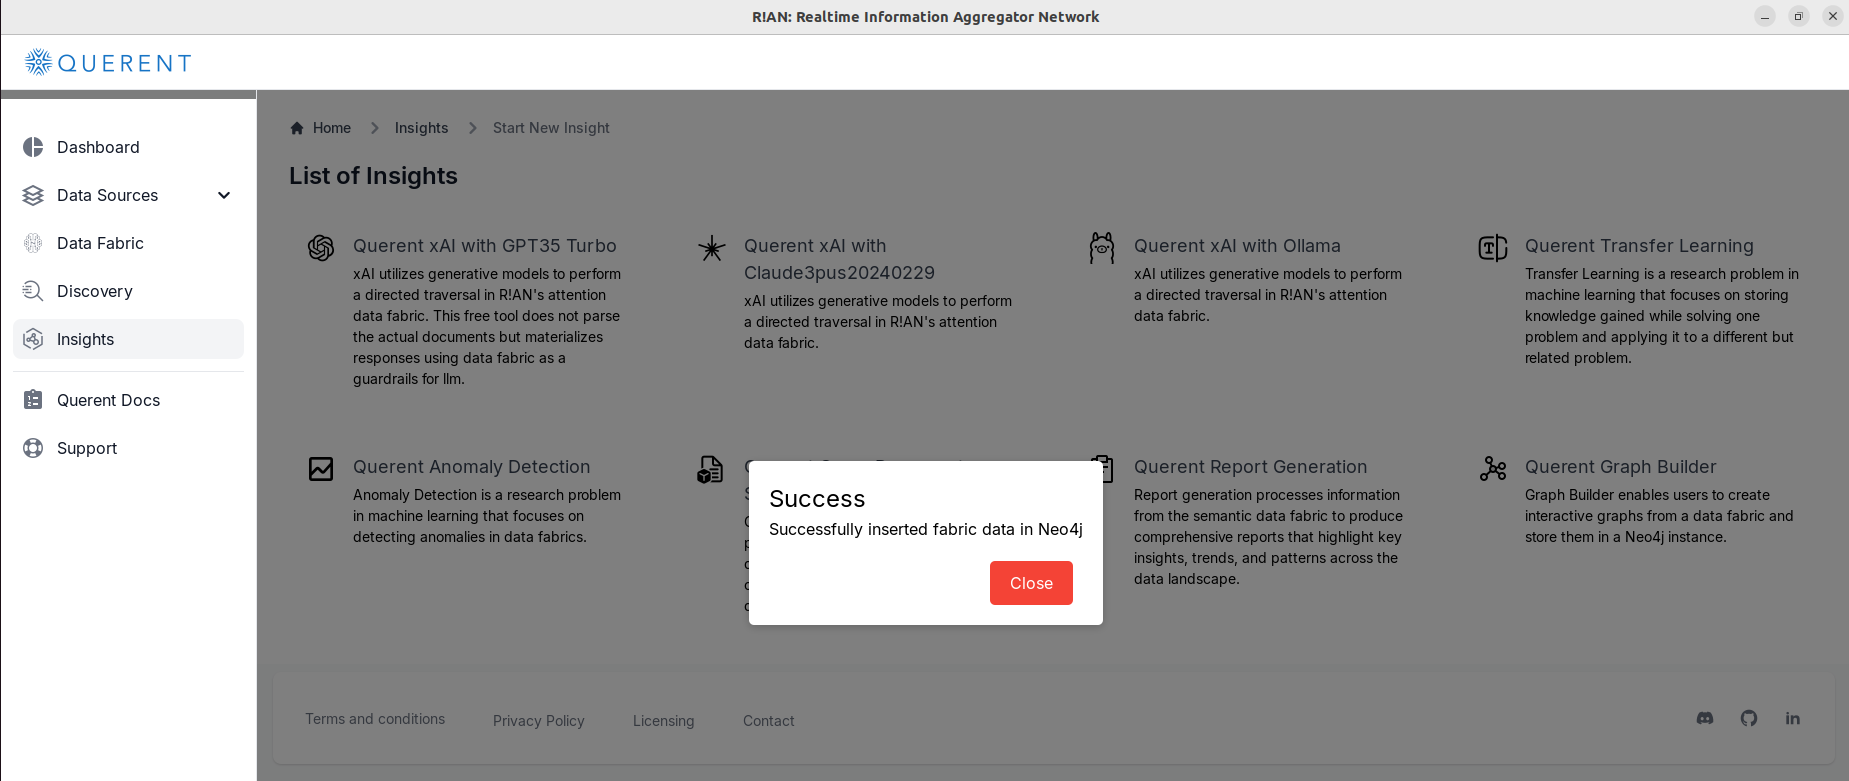
Monitor Progress:
- A confirmation message will appear showing the status of the export.
Visualizing Your Graph in Neo4j
After exporting, you can navigate to your Neo4j instance to visualize and interact with the graph.
-
Open Neo4j Browser:
- Launch the Neo4j Browser application.
-
Log In to Neo4j:
- Enter your Neo4j Username and Password as provided earlier.
-
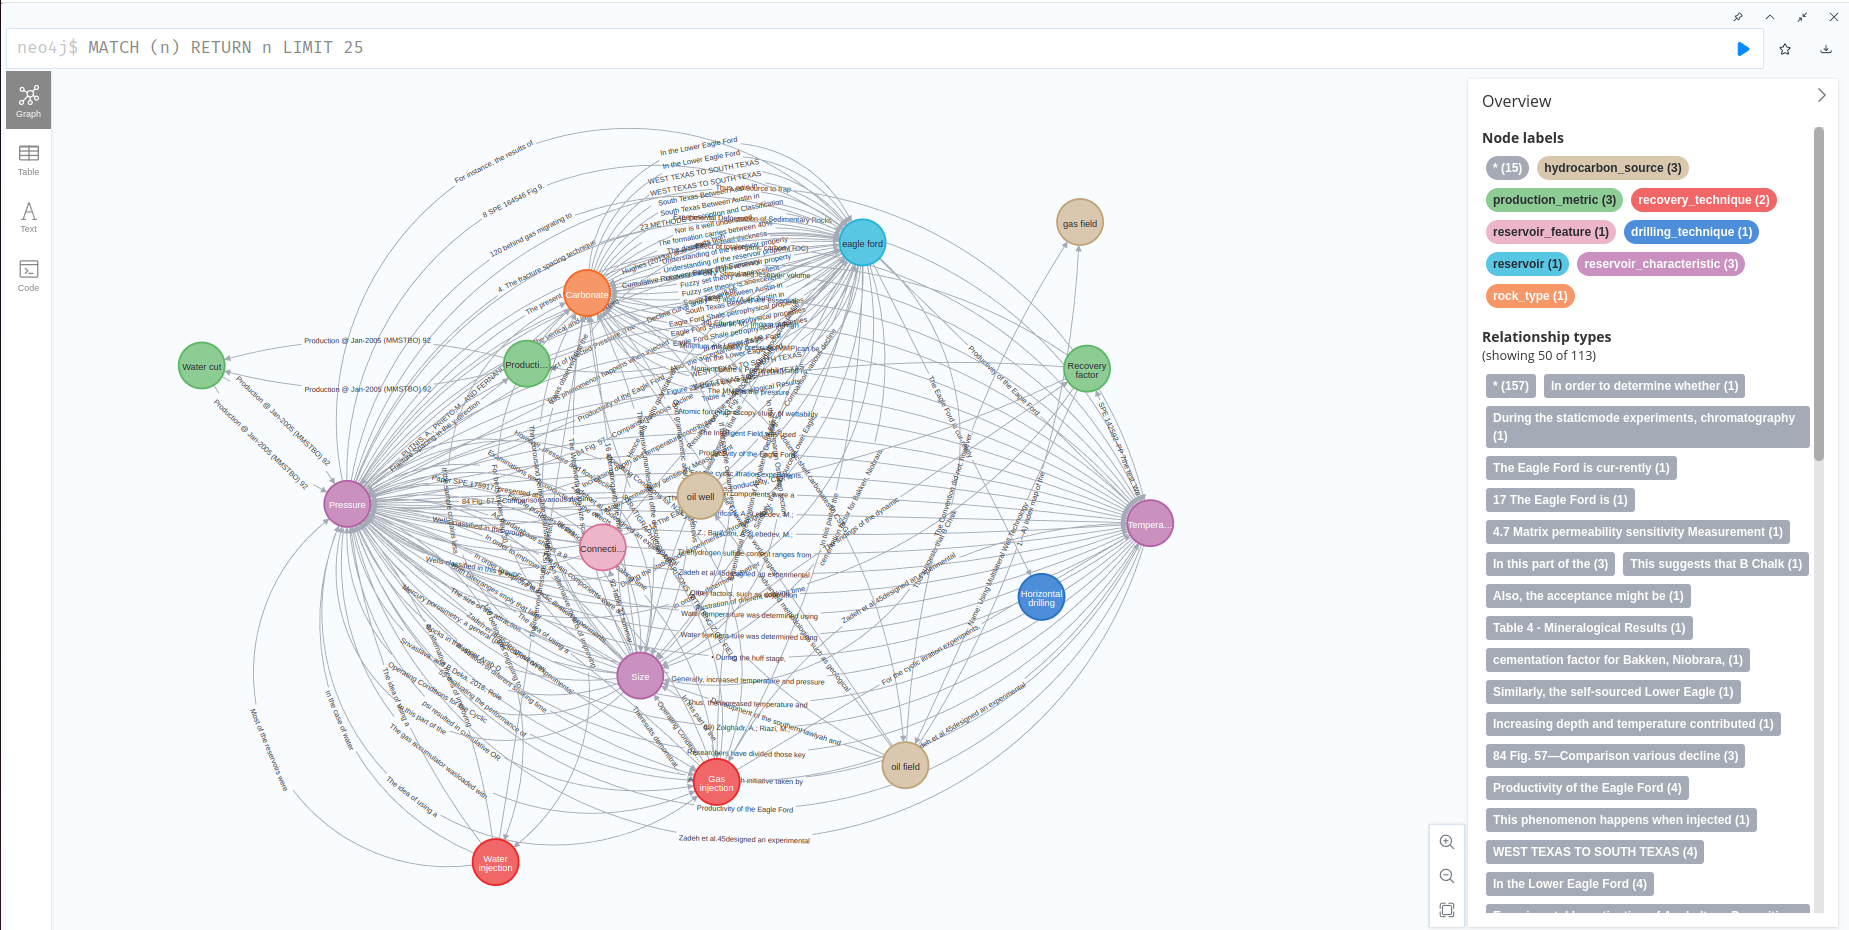
Explore the Graph:
-
Use Neo4j's query language, Cypher, to interact with your graph.
-
For a quick visualization, run the following query in the command line at the top:
MATCH (n)-[r]->(m) RETURN n, r, m LIMIT 25 -
This query retrieves nodes and relationships from your graph and displays them visually.
-
-
Interact with the Graph:
- Zoom and Pan: Navigate through different areas of the graph.
- Node Details: Click on nodes to view their properties and relationships.
- Search: Use the search functionality to find specific nodes or patterns.
Conclusion
By leveraging the Graph Builder, you can transform complex data fabrics into intuitive visualizations within Neo4j. This enables you to:
- Identify Key Entities and Relationships: Quickly spot important nodes and how they are connected.
- Uncover Hidden Patterns: Discover relationships and trends not immediately apparent in raw data.
- Perform Advanced Analytics: Utilize graph algorithms and query capabilities.
- Train GNN Modules: Use your graph data to train Graph Neural Networks for predictive modeling and insights.